I have been playing with RaspberryPI for a while. There are several project I tried to do with RaspberryPI. These boards play a significant role in my home lab for different experiments like Docker Private Repository, Media Server, Ad Blocker with pi-hole, Secure Proxy for anonymity, secure network access with VPN, Home Security Camera/Surveillance, Data Collector or scraper etc. But This time, I did buy a “DHT-22” sensor for monitoring room temperature and humidity. Humidity is my main concern and wanted to see how it fluctuates.
So, my main plan was to get a DHT-22 to connect properly
with my spare RapberryPI 3B+. I did order the sensor and 3 male-to-male jumper for connectivity. Though I should have had a BreadBoard too. However, raspberryPI had already Ubuntu Server 20 installed.
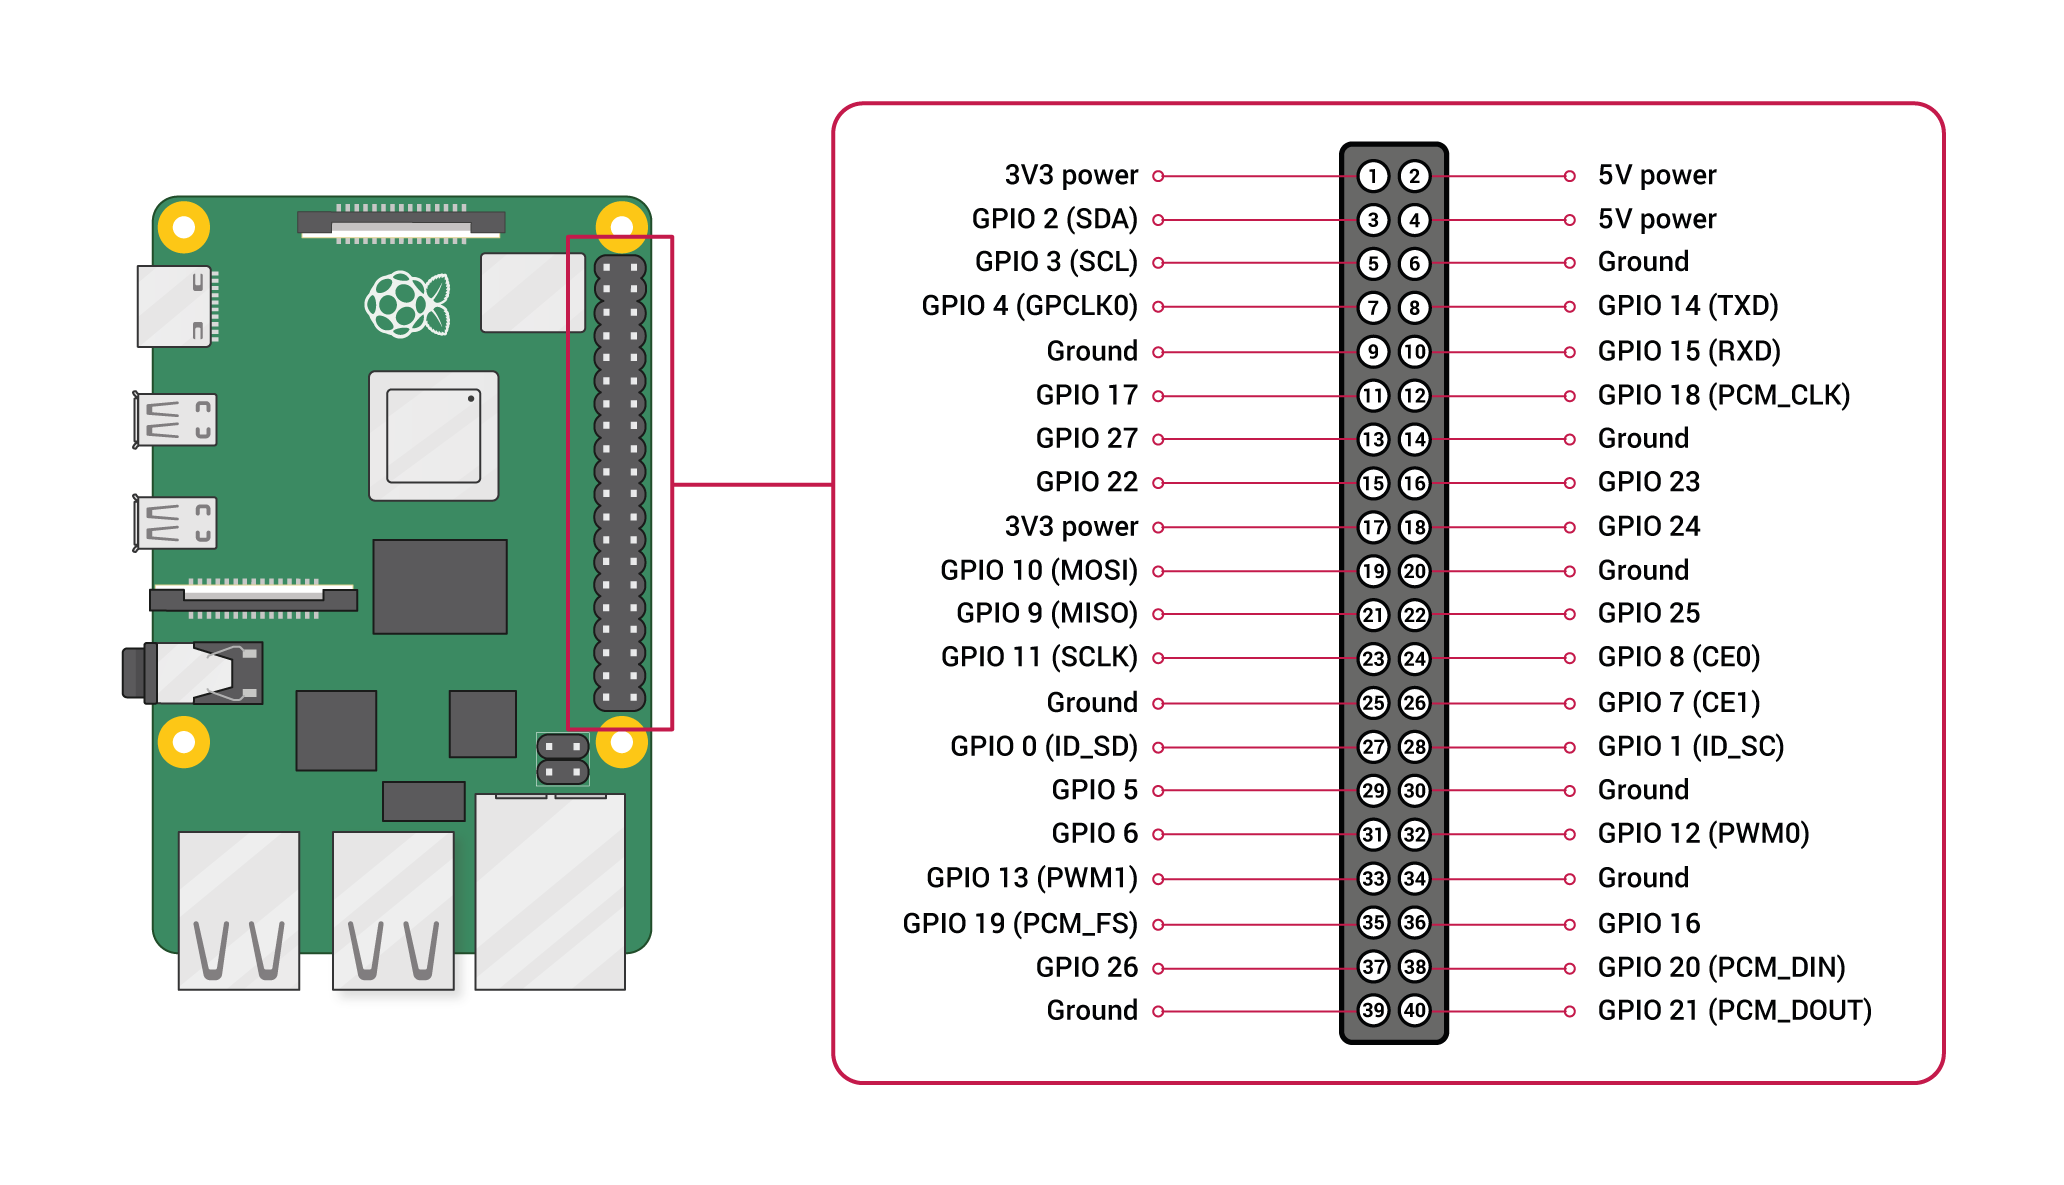
For DHT-22, I needed to connect the female-to-female into the pins
14: Ground
17: 3v3 Power
18: GPIO 24
This GPIO-24 was important to note down as it was needed in Python Code to access the sensor through this pin.
Yes, I have used python to access the sensor. For testing, I have used this code:
#!/usr/bin/python3 import Adafruit_DHT import datetime def th_reader(): # for DHT11 # sensor = 11 # for DHT22 sensor = 22 gpio = 24 h_t = Adafruit_DHT.read_retry(sensor, gpio) humidity = h_t[0] temperature = h_t[1] if humidity is not None and temperature is not None: temp = '{0:0.1f}°C'.format(temperature) humid = '{0:0.1f}%'.format(humidity) return { "temperature": temp, "humidity": humid } else: temp = None humid = None return { "temperature": temp, "humidity": humid } if __name__ == '__main__': print(th_reader())
The output it gives-
{'temperature': '26.1°C', 'humidity': '85.8%'}
But the requirements to run the code is-
sudo apt-get update
sudo apt-get install python3-pip
sudo python3 -m pip install --upgrade pip setuptools wheel
sudo pip3 install Adafruit_DHT
You can check other methods to install from here: https://github.com/adafruit/Adafruit_Python_DHT
This was enough for me. I wanted to run the script every 5 minutes through cron and store the data to already running influxDB instance in another RaspberryPI at which I can create dashboards and others. You can check how I am using InfluxDB through here: https://fahadahammed.com/explore-influxdb-part-1/
So, I did create a bucket in the influxDB and modified the code to this-
#!/usr/bin/python3 import Adafruit_DHT import datetime import threading from influxdb_client import InfluxDBClient, Point, WritePrecision from influxdb_client.client.write_api import SYNCHRONOUS def th_reader(): # for DHT11 # sensor = 11 # for DHT22 sensor = 22 gpio = 24 h_t = Adafruit_DHT.read_retry(sensor, gpio) humidity = h_t[0] temperature = h_t[1] if humidity is not None and temperature is not None: temp = '{0:0.1f}°C'.format(temperature) humid = '{0:0.1f}%'.format(humidity) return { "temperature": temperature, "humidity": humidity } else: temp = None humid = None return { "temperature": temp, "humidity": humid } def write_to_influxdb(data_to_write): # You can generate an API token from the "API Tokens Tab" in the UI token = "<INFLUX_TOKEN>" org = "myorg" bucket = "dht" influx_url = "<INFLUX_URL>" with InfluxDBClient(url=influx_url, token=token, org=org) as client: write_api = client.write_api(write_options=SYNCHRONOUS) pt = Point("temperature").tag("host", "pi").field("temperature", int(data_to_write.get("temperature"))).time(datetime.datetime.utcnow(), WritePrecision.NS) write_api.write(bucket, org, pt) client.close() with InfluxDBClient(url=influx_url, token=token, org=org) as client: write_api = client.write_api(write_options=SYNCHRONOUS) ph = Point("humidity").tag("host", "pi").field("humidity", data_to_write.get("humidity")).time(datetime.datetime.utcnow(), WritePrecision.NS) write_api.write(bucket, org, ph) client.close() return True if __name__ == '__main__': th_data = th_reader() print(th_data) # write_to_influxdb(data_to_write=th_data) t1 = threading.Thread(target=write_to_influxdb, kwargs={"data_to_write": th_data}) t1.start()
If you want to use the code block, please do replace the <INFLUX_URL> and <INFLUX_TOKEN> with valid ones.
Now the output is the same json but without the ‘%’ and ‘°C’. Because I needed to get a numerical value and set the required prefixes in graph.
I have used InfluxDB Data Point to write data.
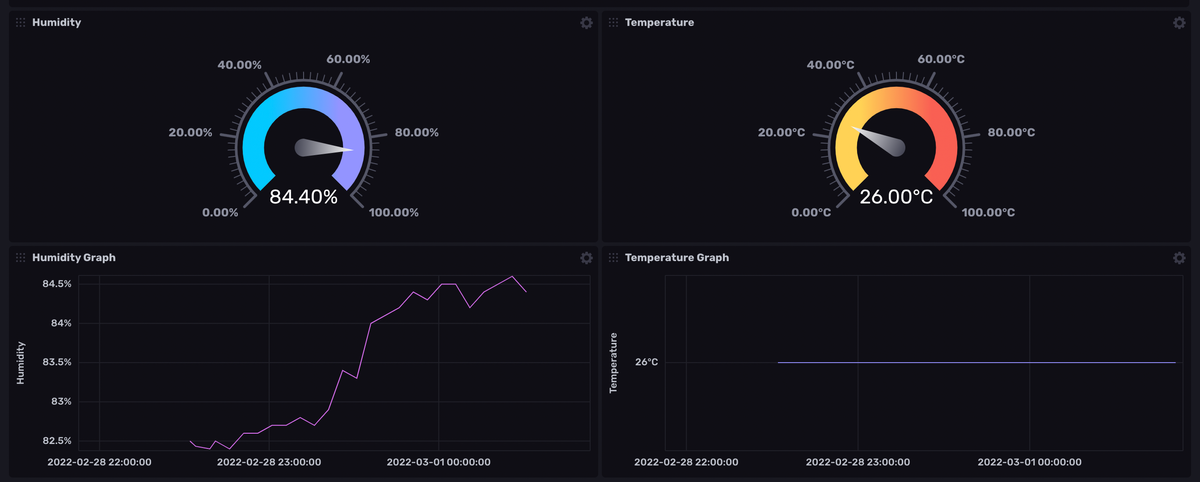
Exported JSON of this minimal dashboard is-
{ | |
"meta": { | |
"version": "1", | |
"type": "dashboard", | |
"name": "Temperature & Humidity via DHT22 Sensor-Template", | |
"description": "template created from dashboard: Temperature & Humidity via DHT22 Sensor" | |
}, | |
"content": { | |
"data": { | |
"type": "dashboard", | |
"attributes": { | |
"name": "Temperature & Humidity via DHT22 Sensor", | |
"description": "" | |
}, | |
"relationships": { | |
"label": { | |
"data": [] | |
}, | |
"cell": { | |
"data": [ | |
{ | |
"type": "cell", | |
"id": "08fc4b18c8fe1000" | |
}, | |
{ | |
"type": "cell", | |
"id": "08fc4b9c79fe1000" | |
}, | |
{ | |
"type": "cell", | |
"id": "08fc4dc3b5fe1000" | |
}, | |
{ | |
"type": "cell", | |
"id": "08fc4e064fbe1000" | |
} | |
] | |
}, | |
"variable": { | |
"data": [] | |
} | |
} | |
}, | |
"included": [ | |
{ | |
"id": "08fc4b18c8fe1000", | |
"type": "cell", | |
"attributes": { | |
"x": 0, | |
"y": 0, | |
"w": 6, | |
"h": 3 | |
}, | |
"relationships": { | |
"view": { | |
"data": { | |
"type": "view", | |
"id": "08fc4b18c8fe1000" | |
} | |
} | |
} | |
}, | |
{ | |
"id": "08fc4b9c79fe1000", | |
"type": "cell", | |
"attributes": { | |
"x": 6, | |
"y": 0, | |
"w": 6, | |
"h": 3 | |
}, | |
"relationships": { | |
"view": { | |
"data": { | |
"type": "view", | |
"id": "08fc4b9c79fe1000" | |
} | |
} | |
} | |
}, | |
{ | |
"id": "08fc4dc3b5fe1000", | |
"type": "cell", | |
"attributes": { | |
"x": 6, | |
"y": 3, | |
"w": 6, | |
"h": 3 | |
}, | |
"relationships": { | |
"view": { | |
"data": { | |
"type": "view", | |
"id": "08fc4dc3b5fe1000" | |
} | |
} | |
} | |
}, | |
{ | |
"id": "08fc4e064fbe1000", | |
"type": "cell", | |
"attributes": { | |
"x": 0, | |
"y": 3, | |
"w": 6, | |
"h": 3 | |
}, | |
"relationships": { | |
"view": { | |
"data": { | |
"type": "view", | |
"id": "08fc4e064fbe1000" | |
} | |
} | |
} | |
}, | |
{ | |
"type": "view", | |
"id": "08fc4b18c8fe1000", | |
"attributes": { | |
"name": "Humidity", | |
"properties": { | |
"shape": "chronograf-v2", | |
"type": "gauge", | |
"queries": [ | |
{ | |
"text": "from(bucket: \"dht\")\n |> range(start: v.timeRangeStart, stop: v.timeRangeStop)\n |> filter(fn: (r) => r[\"_measurement\"] == \"humidity\")\n |> filter(fn: (r) => r[\"_field\"] == \"humidity\")\n |> filter(fn: (r) => r[\"host\"] == \"pi\")\n |> aggregateWindow(every: v.windowPeriod, fn: mean, createEmpty: false)\n |> yield(name: \"mean\")", | |
"editMode": "advanced", | |
"name": "", | |
"builderConfig": { | |
"buckets": [], | |
"tags": [ | |
{ | |
"key": "_measurement", | |
"values": [], | |
"aggregateFunctionType": "filter" | |
} | |
], | |
"functions": [ | |
{ | |
"name": "mean" | |
} | |
], | |
"aggregateWindow": { | |
"period": "auto", | |
"fillValues": false | |
} | |
} | |
} | |
], | |
"prefix": "", | |
"tickPrefix": "", | |
"suffix": "%", | |
"tickSuffix": "%", | |
"colors": [ | |
{ | |
"id": "0", | |
"type": "min", | |
"hex": "#00C9FF", | |
"name": "laser", | |
"value": 0 | |
}, | |
{ | |
"id": "1", | |
"type": "max", | |
"hex": "#9394FF", | |
"name": "comet", | |
"value": 100 | |
} | |
], | |
"decimalPlaces": { | |
"isEnforced": true, | |
"digits": 2 | |
}, | |
"note": "", | |
"showNoteWhenEmpty": false | |
} | |
} | |
}, | |
{ | |
"type": "view", | |
"id": "08fc4b9c79fe1000", | |
"attributes": { | |
"name": "Temperature", | |
"properties": { | |
"shape": "chronograf-v2", | |
"type": "gauge", | |
"queries": [ | |
{ | |
"text": "from(bucket: \"dht\")\n |> range(start: v.timeRangeStart, stop: v.timeRangeStop)\n |> filter(fn: (r) => r[\"_measurement\"] == \"temperature\")\n |> filter(fn: (r) => r[\"_field\"] == \"temperature\")\n |> filter(fn: (r) => r[\"host\"] == \"pi\")\n |> aggregateWindow(every: v.windowPeriod, fn: mean, createEmpty: false)\n |> yield(name: \"mean\")", | |
"editMode": "advanced", | |
"name": "", | |
"builderConfig": { | |
"buckets": [], | |
"tags": [ | |
{ | |
"key": "_measurement", | |
"values": [], | |
"aggregateFunctionType": "filter" | |
} | |
], | |
"functions": [ | |
{ | |
"name": "mean" | |
} | |
], | |
"aggregateWindow": { | |
"period": "auto", | |
"fillValues": false | |
} | |
} | |
} | |
], | |
"prefix": "", | |
"tickPrefix": "", | |
"suffix": "°C", | |
"tickSuffix": "°C", | |
"colors": [ | |
{ | |
"id": "0", | |
"type": "min", | |
"hex": "#FFD255", | |
"name": "thunder", | |
"value": 0 | |
}, | |
{ | |
"id": "1", | |
"type": "max", | |
"hex": "#F95F53", | |
"name": "curacao", | |
"value": 100 | |
} | |
], | |
"decimalPlaces": { | |
"isEnforced": true, | |
"digits": 2 | |
}, | |
"note": "", | |
"showNoteWhenEmpty": false | |
} | |
} | |
}, | |
{ | |
"type": "view", | |
"id": "08fc4dc3b5fe1000", | |
"attributes": { | |
"name": "Temperature Graph", | |
"properties": { | |
"shape": "chronograf-v2", | |
"queries": [ | |
{ | |
"text": "from(bucket: \"dht\")\n |> range(start: v.timeRangeStart, stop: v.timeRangeStop)\n |> filter(fn: (r) => r[\"_measurement\"] == \"temperature\")\n |> filter(fn: (r) => r[\"_field\"] == \"temperature\")\n |> filter(fn: (r) => r[\"host\"] == \"pi\")\n |> aggregateWindow(every: v.windowPeriod, fn: mean, createEmpty: false)\n |> yield(name: \"mean\")", | |
"editMode": "advanced", | |
"name": "", | |
"builderConfig": { | |
"buckets": [], | |
"tags": [ | |
{ | |
"key": "_measurement", | |
"values": [], | |
"aggregateFunctionType": "filter" | |
} | |
], | |
"functions": [ | |
{ | |
"name": "mean" | |
} | |
], | |
"aggregateWindow": { | |
"period": "auto", | |
"fillValues": false | |
} | |
} | |
} | |
], | |
"axes": { | |
"x": { | |
"bounds": [ | |
"", | |
"" | |
], | |
"label": "", | |
"prefix": "", | |
"suffix": "", | |
"base": "10", | |
"scale": "linear" | |
}, | |
"y": { | |
"bounds": [ | |
"", | |
"" | |
], | |
"label": "Temperature", | |
"prefix": "", | |
"suffix": "°C", | |
"base": "10", | |
"scale": "linear" | |
} | |
}, | |
"type": "xy", | |
"staticLegend": { | |
"colorizeRows": true, | |
"opacity": 1, | |
"orientationThreshold": 100000000, | |
"widthRatio": 1 | |
}, | |
"geom": "line", | |
"colors": [ | |
{ | |
"id": "ec36837f-84bd-43b6-be10-970343f0bbca", | |
"type": "scale", | |
"hex": "#8F8AF4", | |
"name": "Do Androids Dream of Electric Sheep?", | |
"value": 0 | |
}, | |
{ | |
"id": "ad64f52f-fadd-48ca-9365-98e8a5e3ce39", | |
"type": "scale", | |
"hex": "#A51414", | |
"name": "Do Androids Dream of Electric Sheep?", | |
"value": 0 | |
}, | |
{ | |
"id": "6a1fc916-9b65-481f-b0df-7662b75468d8", | |
"type": "scale", | |
"hex": "#F4CF31", | |
"name": "Do Androids Dream of Electric Sheep?", | |
"value": 0 | |
} | |
], | |
"note": "", | |
"showNoteWhenEmpty": false, | |
"xColumn": "_time", | |
"generateXAxisTicks": [], | |
"xTotalTicks": 0, | |
"xTickStart": 0, | |
"xTickStep": 0, | |
"yColumn": "_value", | |
"generateYAxisTicks": [], | |
"yTotalTicks": 0, | |
"yTickStart": 0, | |
"yTickStep": 0, | |
"shadeBelow": false, | |
"position": "overlaid", | |
"timeFormat": "", | |
"hoverDimension": "auto", | |
"legendColorizeRows": true, | |
"legendHide": false, | |
"legendOpacity": 1, | |
"legendOrientationThreshold": 100000000 | |
} | |
} | |
}, | |
{ | |
"type": "view", | |
"id": "08fc4e064fbe1000", | |
"attributes": { | |
"name": "Humidity Graph", | |
"properties": { | |
"shape": "chronograf-v2", | |
"queries": [ | |
{ | |
"text": "from(bucket: \"dht\")\n |> range(start: v.timeRangeStart, stop: v.timeRangeStop)\n |> filter(fn: (r) => r[\"_measurement\"] == \"humidity\")\n |> filter(fn: (r) => r[\"_field\"] == \"humidity\")\n |> filter(fn: (r) => r[\"host\"] == \"pi\")\n |> aggregateWindow(every: v.windowPeriod, fn: mean, createEmpty: false)\n |> yield(name: \"mean\")", | |
"editMode": "advanced", | |
"name": "", | |
"builderConfig": { | |
"buckets": [], | |
"tags": [ | |
{ | |
"key": "_measurement", | |
"values": [], | |
"aggregateFunctionType": "filter" | |
} | |
], | |
"functions": [ | |
{ | |
"name": "mean" | |
} | |
], | |
"aggregateWindow": { | |
"period": "auto", | |
"fillValues": false | |
} | |
} | |
} | |
], | |
"axes": { | |
"x": { | |
"bounds": [ | |
"", | |
"" | |
], | |
"label": "", | |
"prefix": "", | |
"suffix": "", | |
"base": "10", | |
"scale": "linear" | |
}, | |
"y": { | |
"bounds": [ | |
"", | |
"" | |
], | |
"label": "Humidity", | |
"prefix": "", | |
"suffix": "%", | |
"base": "10", | |
"scale": "linear" | |
} | |
}, | |
"type": "xy", | |
"staticLegend": { | |
"colorizeRows": true, | |
"opacity": 1, | |
"orientationThreshold": 100000000, | |
"widthRatio": 1 | |
}, | |
"geom": "line", | |
"colors": [ | |
{ | |
"id": "c98cc8b9-7e68-4355-8087-2e26c682386d", | |
"type": "scale", | |
"hex": "#DA6FF1", | |
"name": "Ectoplasm", | |
"value": 0 | |
}, | |
{ | |
"id": "c817625b-9b18-4202-806f-bcec388a7333", | |
"type": "scale", | |
"hex": "#00717A", | |
"name": "Ectoplasm", | |
"value": 0 | |
}, | |
{ | |
"id": "0806b63a-2228-49d8-8a31-dfd8cbcf9912", | |
"type": "scale", | |
"hex": "#ACFF76", | |
"name": "Ectoplasm", | |
"value": 0 | |
} | |
], | |
"note": "", | |
"showNoteWhenEmpty": false, | |
"xColumn": "_time", | |
"generateXAxisTicks": [], | |
"xTotalTicks": 0, | |
"xTickStart": 0, | |
"xTickStep": 0, | |
"yColumn": "_value", | |
"generateYAxisTicks": [], | |
"yTotalTicks": 0, | |
"yTickStart": 0, | |
"yTickStep": 0, | |
"shadeBelow": false, | |
"position": "overlaid", | |
"timeFormat": "", | |
"hoverDimension": "auto", | |
"legendColorizeRows": true, | |
"legendHide": false, | |
"legendOpacity": 1, | |
"legendOrientationThreshold": 100000000 | |
} | |
} | |
} | |
] | |
}, | |
"labels": [] | |
} |
I have other plans to use the DHT-22 like controlling exhaust fan or similar. Maybe later. For now, I will just collect data and observe the fluctuation of my rooms temperature and humidity.
It was fun working with InfluxDB and DHT-22 with RaspberryPI.
Thanks for reading. Please give me feedback If you have idea for me or point me some improvements.
Share this:
- Click to share on Twitter (Opens in new window)
- Click to share on Facebook (Opens in new window)
- Click to share on LinkedIn (Opens in new window)
- Click to share on Pinterest (Opens in new window)
- Click to share on Tumblr (Opens in new window)
- Click to share on Pocket (Opens in new window)
- Click to share on Reddit (Opens in new window)
- Click to share on Telegram (Opens in new window)
- Click to share on WhatsApp (Opens in new window)
- Click to print (Opens in new window)
- Click to email a link to a friend (Opens in new window)