Explore InfluxDB: Part 1

I have been trying to manage time to explore InfluxDB for observability. This article is one of many about InfluxDB and Telegraf. I will cover basic installation here.
To install InfluxDB I have used docker-compose for now. In future, maybe I will choose and share some other form of installation.
docker-compose.yaml
version: '3.8'

networks:
  influxdb:

services:
  influxdb:
    image: 'influxdb:latest'
    networks:
      - influxdb
    ports:
      - 8086:8086
    volumes:
      - $PWD/data/influxdb2_data:/var/lib/influxdb2
      - $PWD/data/influxdb2_config:/etc/influxdb2
    restart: on-failure
    environment:
      - TZ=Asia/Dhaka
      - DOCKER_INFLUXDB_INIT_MODE=setup
      - DOCKER_INFLUXDB_INIT_USERNAME=influxdb
      - DOCKER_INFLUXDB_INIT_PASSWORD=influxdb
      - DOCKER_INFLUXDB_INIT_ORG=myorg
      - DOCKER_INFLUXDB_INIT_BUCKET=mybucket
$ docker-compose up -dNormally, image: 'influxdb:latest' is denoting to latest version of influx, influxdb2+.
Now we need telegraf on our servers from where we will get the metrics.
I have a ubuntu server at which some application is running.
- Docker
- Nginx
- Redis
So, I wanted to monitor those as well as host information.
First, I have installed telegraf.
$ sudo wget https://dl.influxdata.com/telegraf/releases/telegraf_1.21.3-1_amd64.deb
$ sudo dpkg -i telegraf_1.21.3-1_amd64.deb
It will enable a systemd service and make it running when installation complete. After installation, stop the service.
$ sudo service telegraf stopmake a backup of the configuration file
$ sudo mv /etc/telegraf/telegraf.conf /etc/telegraf.conf_backupCreate a new configuration with passing some parameters
$ sudo telegraf --sample-config --input-filter cpu:mem:system:net:swap:processes:disk:diskio:docker:nginx:redis --output-filter influxdb_v2 > /etc/telegraf/telegraf.confHere we are generating sample config and writing the config to the default config file of telgraf. I have used some plugins to send the metrics to influxdb.
- cpu
- mem
- system
- net
- swap
- processes
- disk
- diskio
- docker
- nginx
- redis
After that, need to pass token to allow this telegraf for sending metrics to the influxdb and also the influxdb endpoint.
# Configuration for sending metrics to InfluxDB
[[outputs.influxdb_v2]]
  ## The URLs of the InfluxDB cluster nodes.
  ##
  ## Multiple URLs can be specified for a single cluster, only ONE of the
  ## urls will be written to each interval.
  ##   ex: urls = ["https://us-west-2-1.aws.cloud2.influxdata.com"]
  urls = ["http://localhost:8086"]
  ## Token for authentication.
  token = ""

  ## Organization is the name of the organization you wish to write to; must exist.
  organization = "myorg"

  ## Destination bucket to write into.
  bucket = "mybucket"
Change the url of the influxdb and also the token collected from Influxdb Data>API Tokens. Also need to change the organization and bucket if you want.
Restart the telegraf.
$ sudo service telegraf restartAs soon as telegraf starts sending the data, You should be able to get the already created/default dashboard for system where you will be able to get information about uptime, load, cpu, memory, disk etc information. But what I also needed is nginx dashboard, redis and Docker dashboard.
Community plugins can be found here – https://github.com/influxdata/community-templates
- Redis: https://raw.githubusercontent.com/influxdata/community-templates/master/redis/redis.yml
- Nginx: https://raw.githubusercontent.com/influxdata/community-templates/master/nginx_mysql/nginx_mysql.yml
- Docker: https://raw.githubusercontent.com/influxdata/community-templates/master/docker/docker.yml
To Apply the templates you can use –
influx apply -f <url_to_dashboard_template_yaml_file>Or
You can just import through the dashboard itself. Settings>Template>Lookup Template with the url in the input field.
Redis was kind of readymade. But Nginx and Docker needed to change some parameters/variables.
For nginx, there are two variables created and can be changed.
- mysqlBucket
- nginxBucket
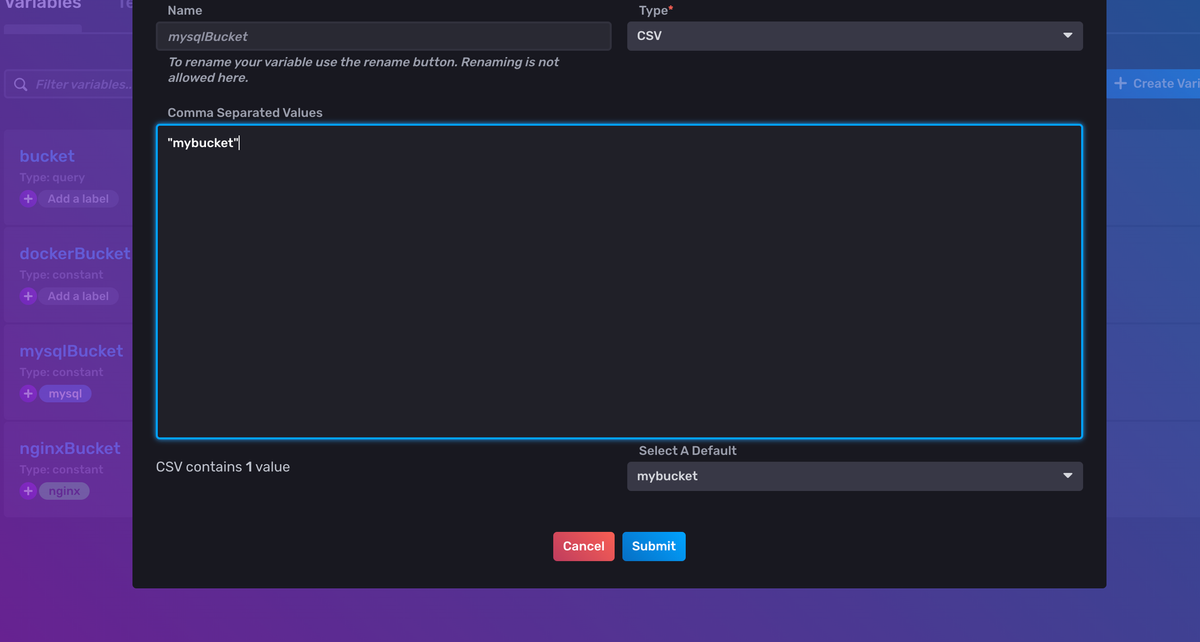
I did set only for nginx, as I did not need MySQL for now. I changed the bucket to my bucket at which telegraf is sending the metrics.
For Docker, there were no variables in the template file but default bucket set to docker. But I was not sending the metrics to the bucket named “docker”. So, I needed to edit all the graphs of the dashoard and replace the bucket “docker” with v.dockerBucket. Created a variable named dockerBucket setting value to the bucket where telegraf already sending the metrics.
Also I needed to add telegraf user to the docker group for giving telegraf permission to read docker stat from docker daemon.
sudo usermod -aG docker telegrafThis is the solution of below error on telegraf service.
2022-02-01T12:40:00Z E! [inputs.docker] Error in plugin: Got permission denied while trying to connect to the Docker daemon socket at unix:///var/run/docker.sock: Get "http://%2Fvar%2Frun%2Fdocker.sock/v1.21/info": dial unix /var/run/docker.sock: connect: permission denied,
2022-02-01T12:40:00Z E! [inputs.docker] Error in plugin: Got permission denied while trying to connect to the Docker daemon socket at unix:///var/run/docker.sock: Get "http://%2Fvar%2Frun%2Fdocker.sock/v1.21/containers/json?filters=%7B%22status%22%3A%5B%22running%22%5D%7D&limit=0": dial unix /var/run/docker.sock: connect: permission denied
For nginx, I needed to set some config to get the status too. First, needed to check if nginx install has the required module or not.
$ nginx -V 2>&1 | grep -o with-http_stub_status_moduleIf it doesn’t return anything then we need to install that module.
After having that, I have created a location block which will give nginx status in return.
location /nginx_status {
 	stub_status;
 	allow 127.0.0.1;	#only allow requests from localhost
 	deny all;		#deny all other hosts
 }
This endpoint was giving me some statistics/metrics of nginx itself. I needed to set this url to telegraf and restart telegraf service.
# Read Nginx's basic status information (ngx_http_stub_status_module)
[[inputs.nginx]]
  # An array of Nginx stub_status URI to gather stats.
  urls = ["http://localhost/nginx_status"]

  ## Optional TLS Config
  #tls_ca = "/etc/telegraf/ca.pem"
  #tls_cert = "/etc/telegraf/cert.cer"
  #tls_key = "/etc/telegraf/key.key"
  ## Use TLS but skip chain & host verification
  insecure_skip_verify = false
Thus the required dashboards are ready. I might need some more later.
Final dashboard for one of my RaspberryPi 3B+ as of now:

In next part I will try to cover the alert and task. Thank you for reading.